
1
Please refer to important disclosures at the end of this report
1
1
Angel Top Picks – June 2020
Worst of Covid-19 crisis seem to be behind for developed economies –– Rapid
spread of Covid – 19 globally had led to Governments resorting to unprecedented
measures including nationwide shutdowns across the world including Europe,
while the US issued strict social distancing guidelines. The global lockdowns have
clearly slowed the spread of the Covid – 19 especially in countries which had been
impacted early on. New additions in Europe have slowed down significantly and
they have already opened up significant parts of their economy. While the US has
been the worst effected country with almost 2mn confirmed cases, the peak of
crisis seem to be behind them and all states have begun reopening their economy.
Monetary and fiscal stimulus by major economies leading to global equity rally –
Central banks and Governments globally have responded with unprecedented
monetary and fiscal stimulus in the aftermath of Covid - 19 in order to contain the
economic damage. The US Fed has pumped in record USD 2.9tn into the
economy through its quantitative easing program since March while most
Governments globally have announced large fiscal packages. As a result there has
been a surge in liquidity leading to a global risk on rally.
Unlock 1.0 and Government stimulus package to drive economic recovery - The
Ministry for Home Affairs (MHA) had announced significant relaxations in
restrictions on the 30th of May 2020. As a result we expect that restrictions will be
lifted in most parts of the country which should lead to increased economic activity
from June onwards. We believe that unlock 1.0 along with the stimulus package
announced by the Government earlier will help the economic recovery to gather
steam from here on.
Cyclical sectors to outperform in near term driven by positive FPI flows – Post the
sharp rally in April Indian markets witnessed a correction in May despite positive
inflows of `14,569 cr. as compared to outflows of `6,884 cr. in the previous
month. Given the US fed fuelled liquidity driven global rally we expect FPI flows to
remain strong which will drive out performance of Indian equities in the near term.
We expect the rally will be more broad based and cyclical sectors like Auto,
banking, construction, consumer goods to outperform in the near term given
beaten down valuations.
Increase in new Covid – 19 cases is key risk for Indian equities going forward -
There has been a mass movement of migrant workers from urban to rural areas
over the past few weeks which is leading to an increase in new cases. Though
India has managed to contain the virus so far by enforcing one of the strictest
lockdown globally, there is a possibility of a jump in new cases down the line given
increased movement of people. In that case the economic recovery may get
pushed back as the Government could be forced to roll back some of the
relaxations. This may result in increased market volatility down the line especially
in cyclical sectors which are leading the current leg of the rally.
Top Picks Performance
Return Since Inception (30th Oct, 2015)
Top Picks Return
44.0%
BSE 100
23.0%
Outperformance
21.0%
Source: Company, Angel Research (as on 2
nd
June, 2020)
Top Picks
Company
CMP (`)
TP (`)
FMCG
Colgate-Palmolive
1,364
1,620
Nestle India
17,020
20,687
P&G Hygiene
10,032
12,230
Britannia Industries
3,450
3,780
Hindustan Unilever
2,107
2,364
Other Consumer Goods
Avenue Supermarts
2,381
2,735
Banking/NBFC
HDFC Ltd
1,815
2,000
ICICI Bank
348
410
Axis Bank
410
500
Bajaj Finance
2,346
3,000
Pharma
IPCA Laboratories
1,555
1,900
Dr Reddy’s Lab
3,896
4,570
IT
Infosys
708
841
L&T Infotech
1,852
2,145
Chemicals/Agrochemicals
PI Industries
1,557
1,785
Galaxy Surfactants
1,360
1,610
Aarti Industries
974
1,284
Telecom/Others
Bharti Airtel
558
672
Reliance Industries
1,536
1,748
Larsen & Toubro
945
1,093
Auto
Escorts
958
1,150
Source: Company, Angel Research
Note: Closing price as on 2nd June,2020

2
Error!
Refer
ence
sourc
Angel Top Picks | June 2020
June 5, 2020
2
Top Picks
3
Error!
Refer
ence
sourc
Angel Top Picks | June 2020
June 5, 2020
3
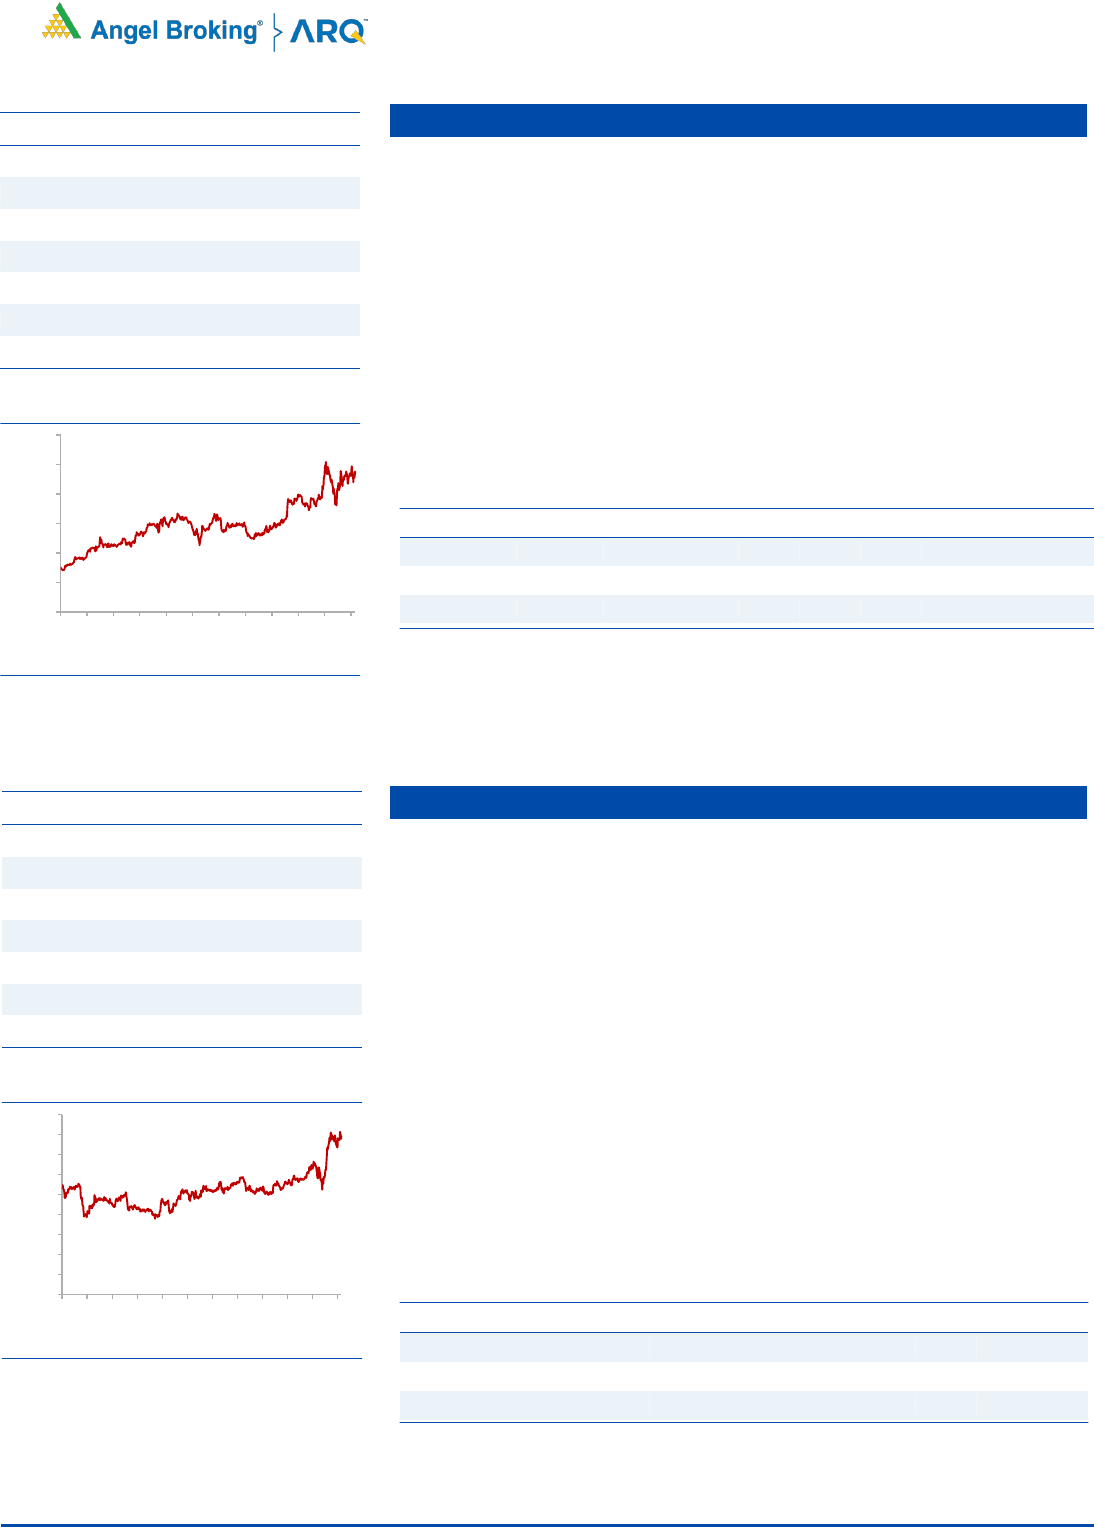
Avenue Supermarts
Avenue Supermarts owns and operates the supermarket chain ‘D-MART’.
Focused on value retailing, it offers a wide range of fast-moving consumer
(food and non-food) products, general merchandise and apparel.
Currently, the company has 196 D-MART stores and it expects to open 30
stores every year through its cluster approach.
DMART offers significant discount compared to e-commerce, Modern trade
(~6%) and General trade (~18%), which would drive revenue growth.
Operating margin is higher compared to its peers due to the company’s low
cost structure.
We expect DMART to report consolidated revenue/PAT CAGR of 19s%/26%,
respectively over FY2019-22E.
Key Financials
Y/E
Sales
OPM
PAT
EPS
ROE
P/E
P/BV
EV/Sales
March
(` cr)
(%)
(` cr)
(`)
(%)
(x)
(x)
(x)
FY2021E
27781
8.4
1419
21.9
17.1
107.4
18.3
5.5
FY2022E
33730
8.8
1825
28.2
18.0
83.5
15.0
4.5
Source: Company, Angel Research
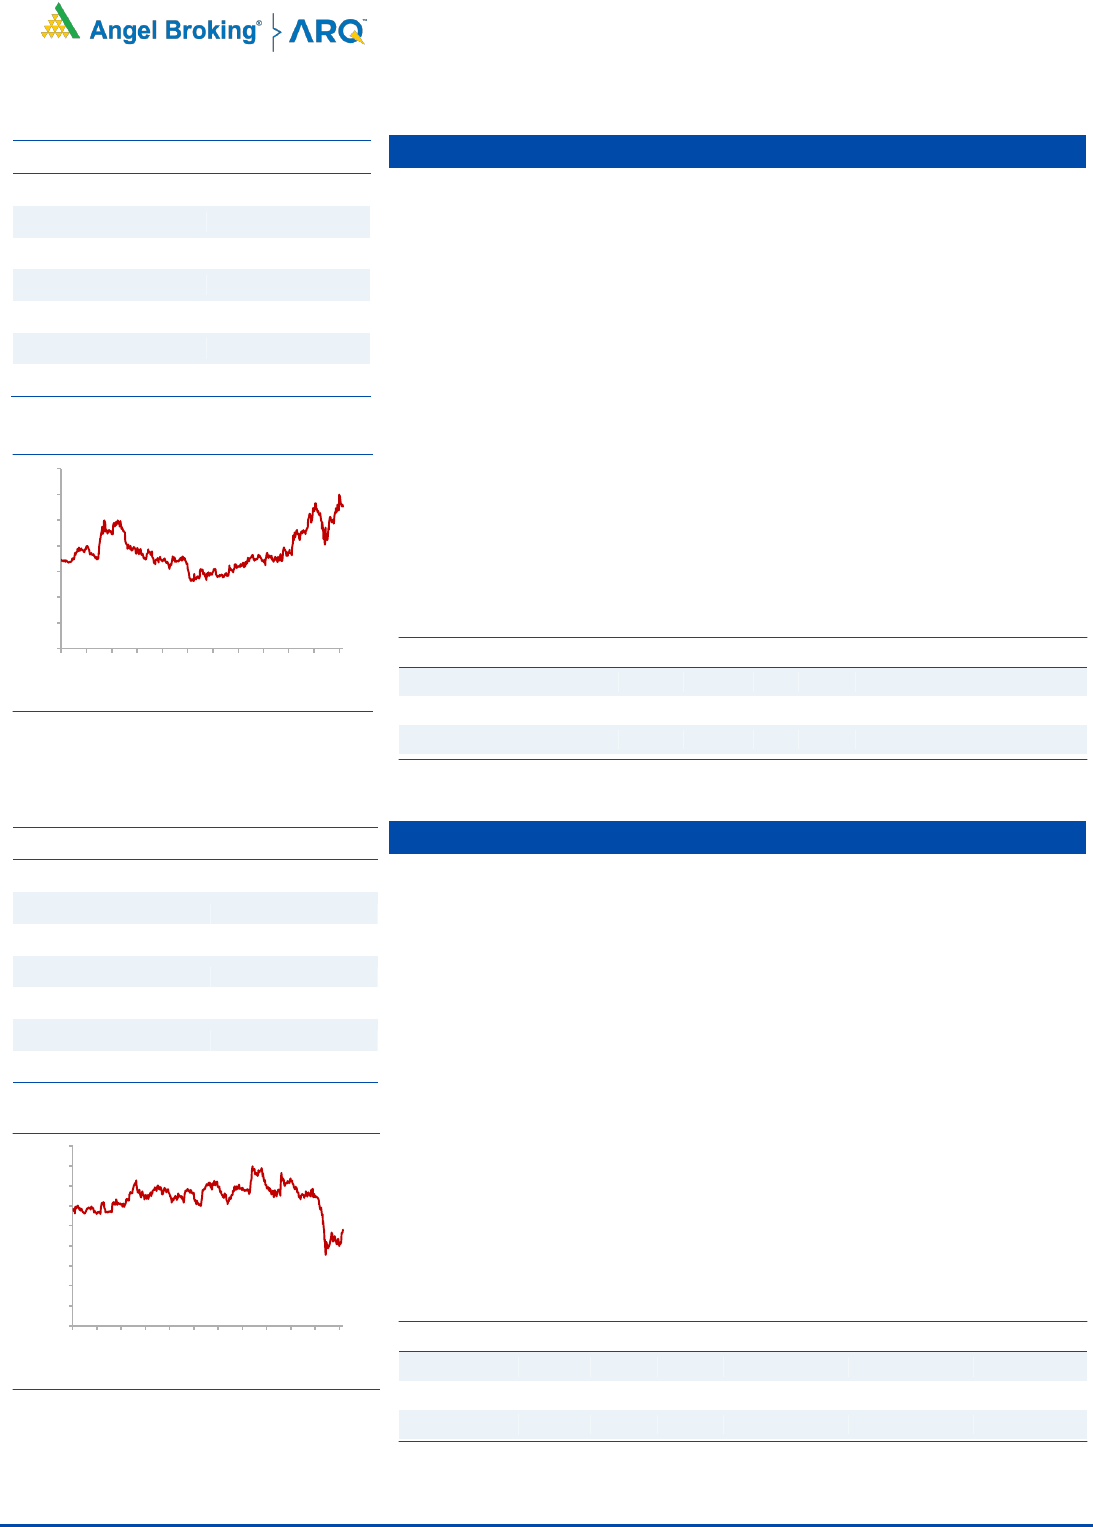
Dr Reddy’s Lab
Dr Reddy’s has a very strong product portfolio with 55%-65% of its revenue
coming from its chronic which is a high growth segment and will be least
impacted due to lockdown globally.
The company has a very healthy US pipeline with 99 ANDA’s pending
approval from the US FDA including 30 FTF’s. The company intends to launch
25 new products FY21.
DRL has incurred large capex over last 5 years with net block increasing from
INR 5380cr in 2015 to INR 9300cr in 2020. With current capacity utilization at
50% we do not envisage any significant capex for the company going forward.
DRL has acquired domestic business of Wockhardt pharma for 800cr in an all
cash deal, which is expected to complete in Q1FY21. DRL will get 62 brands
with total annual sales of 1830cr which we believe is value accretive for the
company
Key Financials
Y/E
Sales
OPM
PAT
EPS
ROE
P/E
P/BV
EV/Sales
March
(` cr)
(%)
(` cr)
(`)
(%)
(x)
(x)
(x)
FY2021E
18840
23.5
2705
166.6
30.5
23.4
4.1
3.4
FY2022E
20855
25
3137
192.6
32
20
3.8
3.1
Source: Company, Angel Research
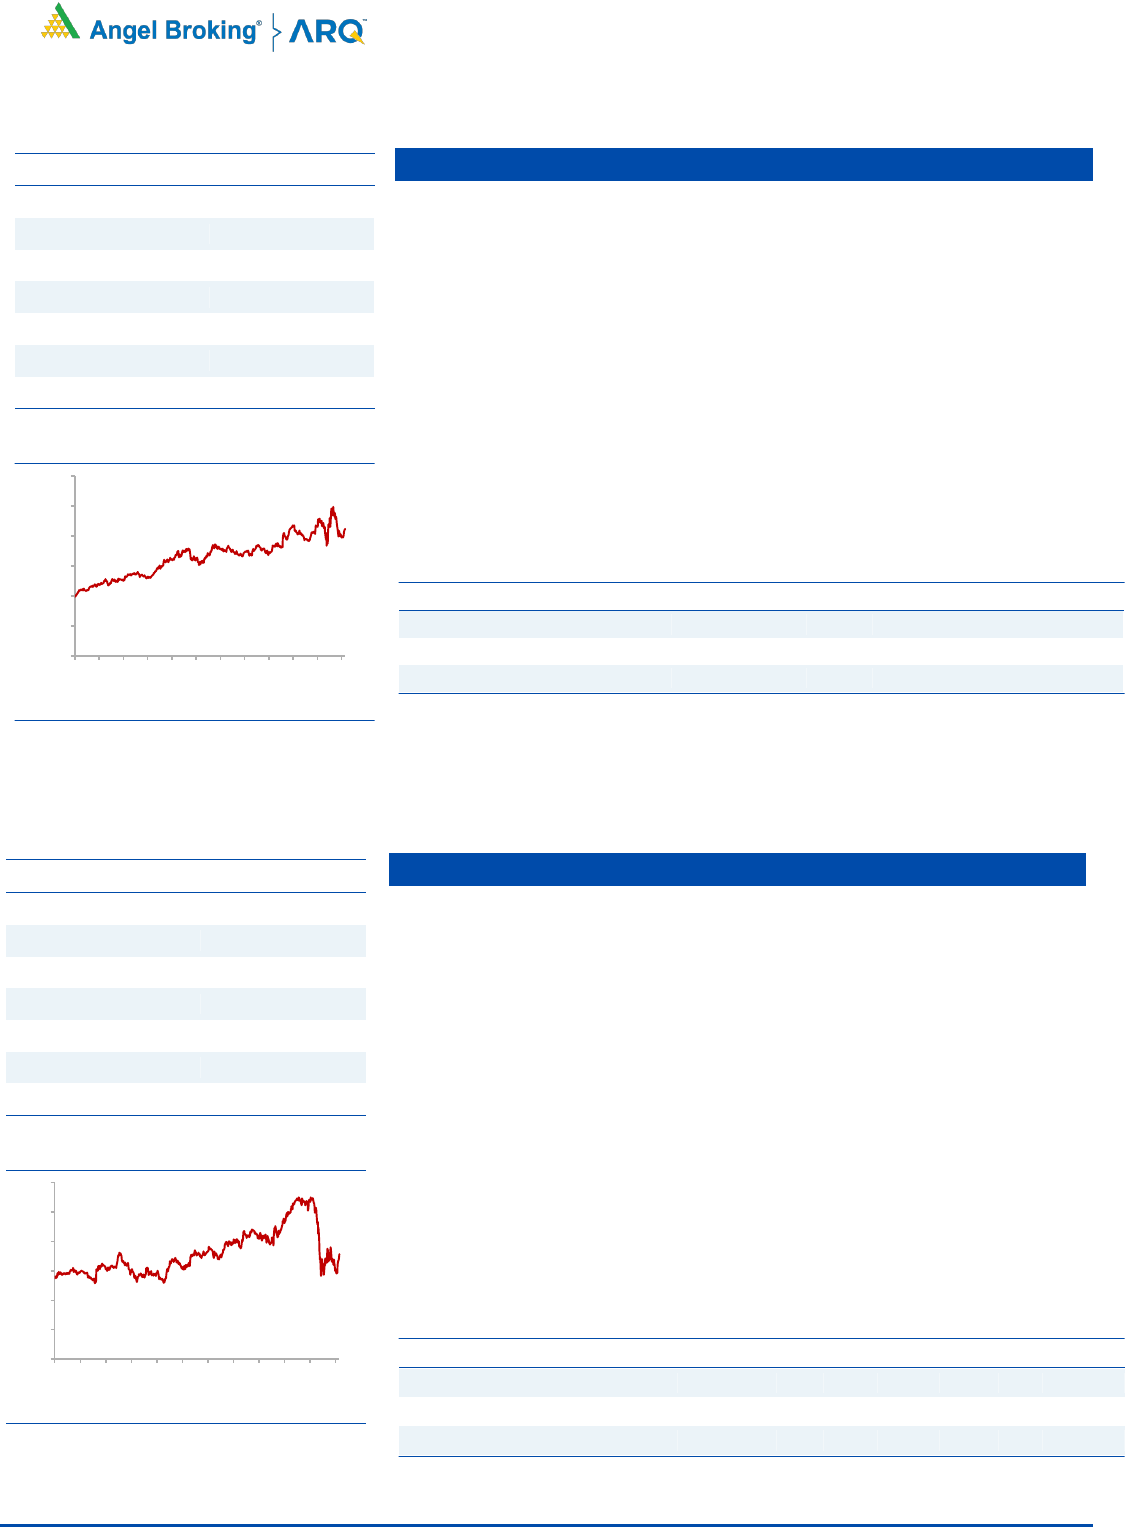
Stock Info
CMP
2,381
TP
2,735
Upside
14.9%
Sector
Retail
Market Cap (` cr)
154,244
Beta
0.7
52 Week High / Low
2,559/1,284
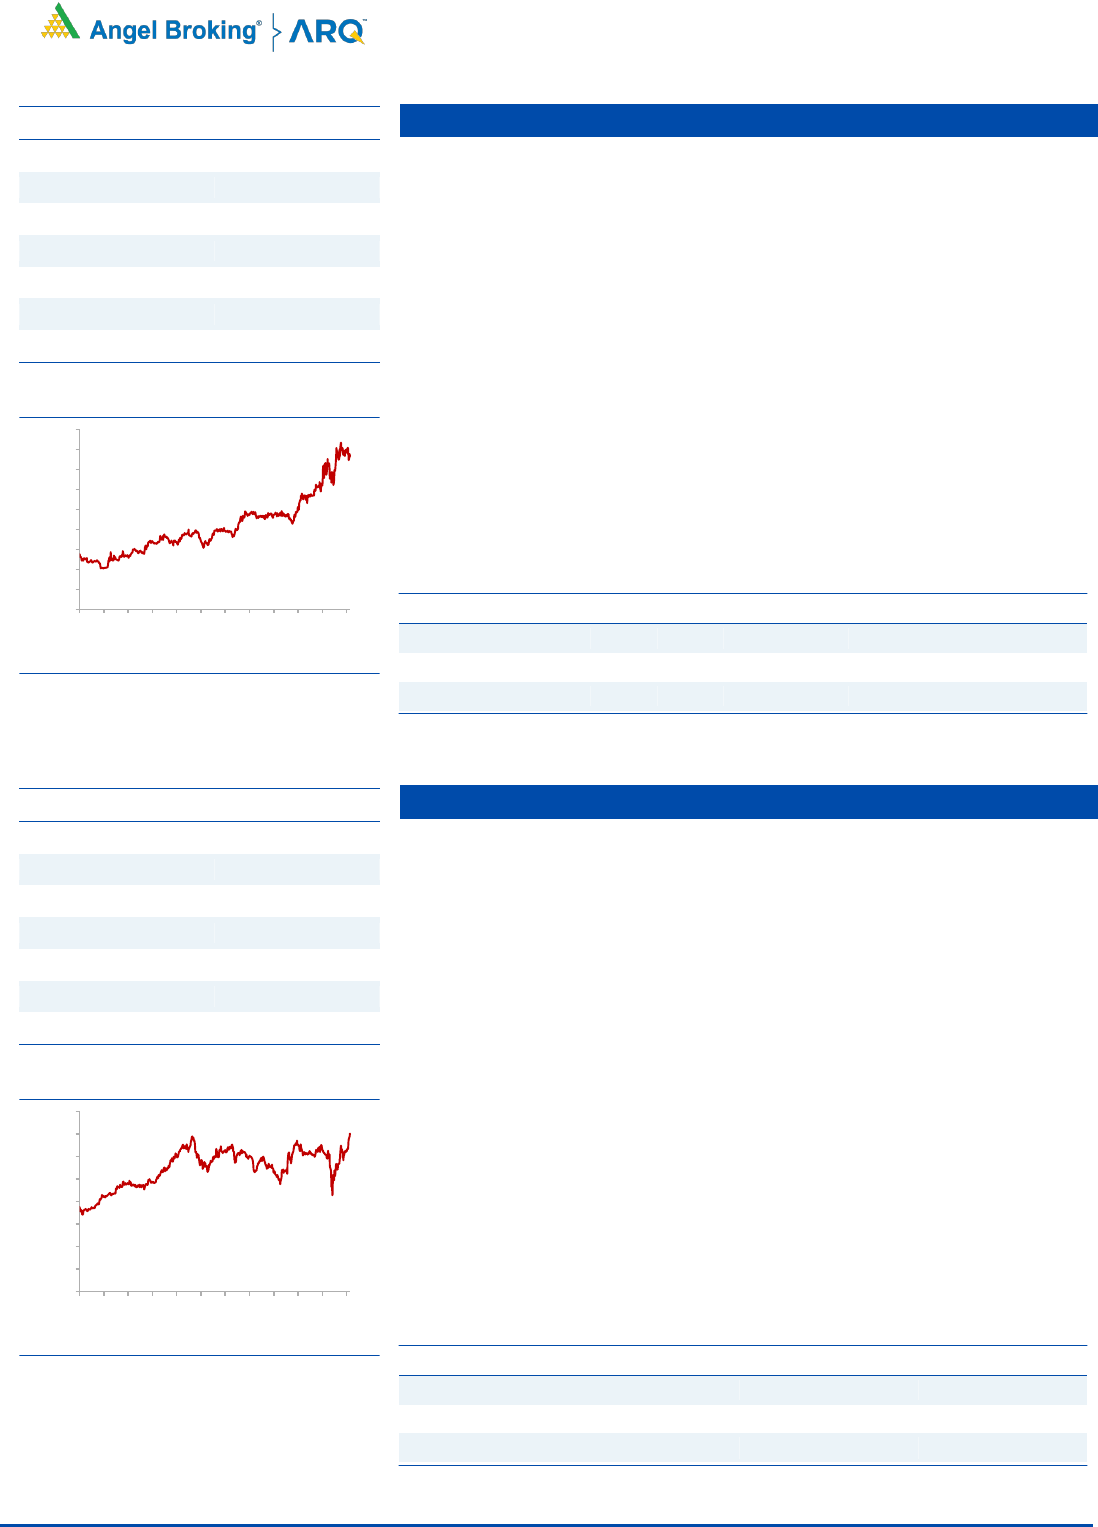
3 year-Chart
Source: Company, Angel Research
-
500
1,000
1,500
2,000
2,500
3,000
May-17
Aug-17
Dec-17
Mar-18
Jun-18
Sep-18
Jan-19
Apr-19
Jul-19
Nov-19
Feb-20
May-20
Stock Info
CMP
3,896
TP
4,570
Upside
17.3%
Sector
Pharma
Market Cap (` cr)
64,755
Beta
0.5
52 Week High / Low
4,099/2,352
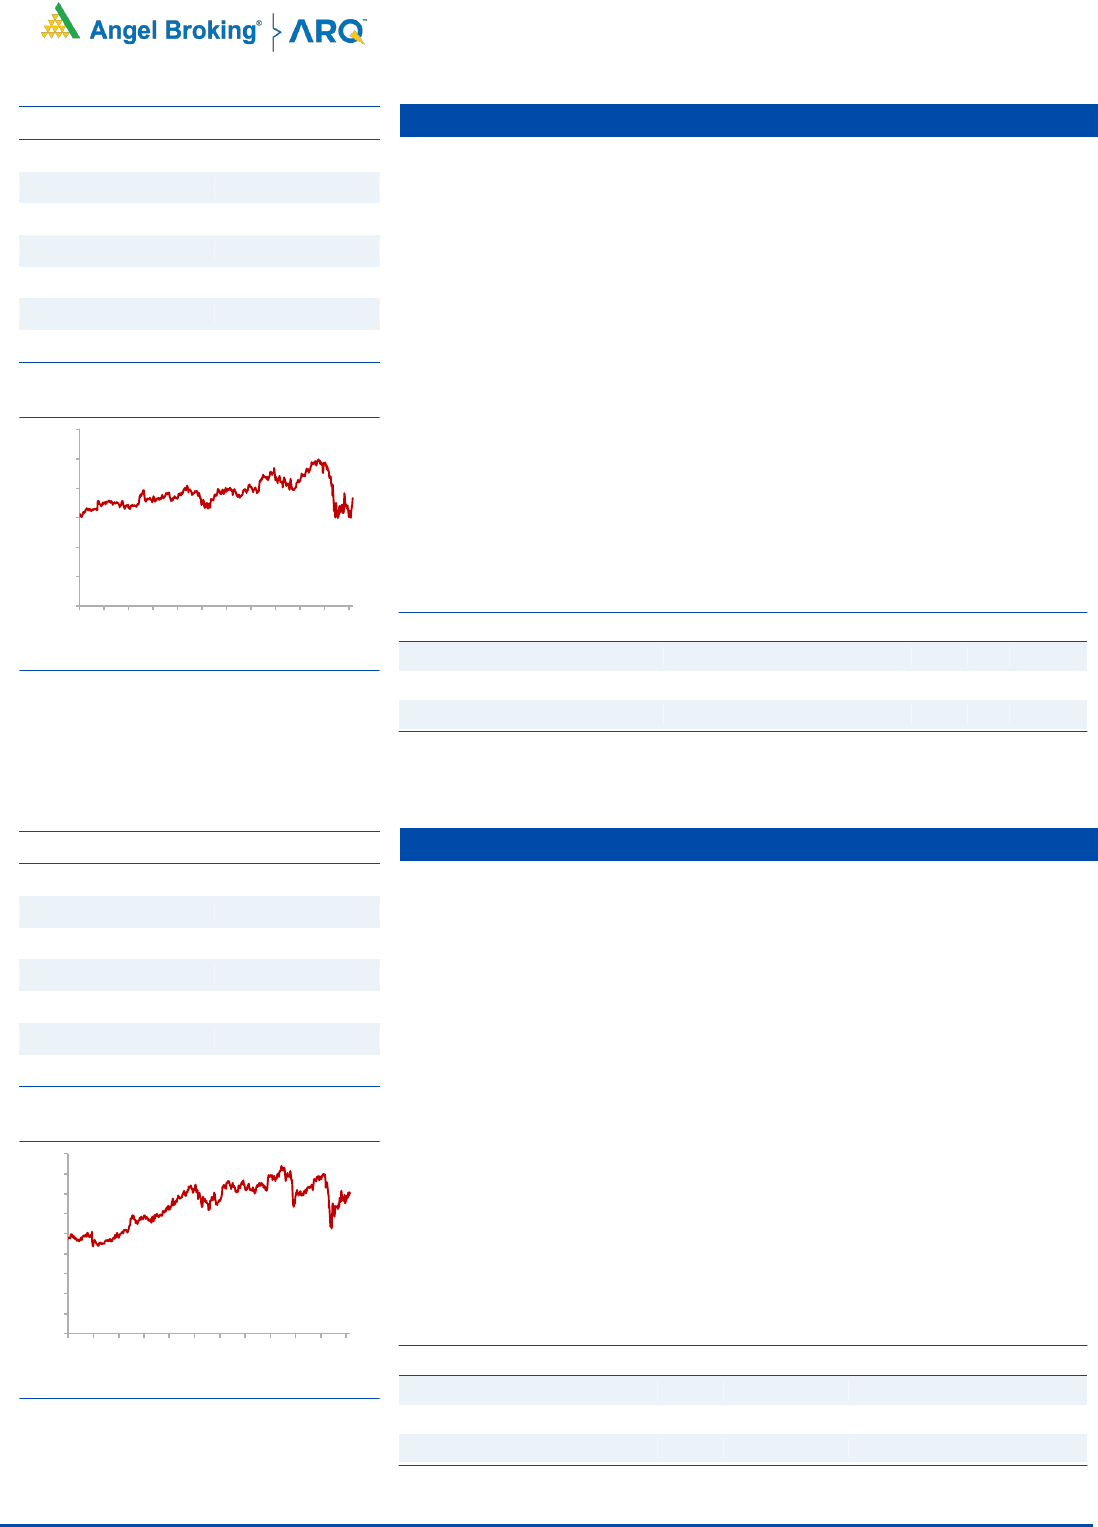
3 year-Chart
Source: Company, Angel Research
-
500
1,000
1,500
2,000
2,500
3,000
3,500
4,000
4,500
May-17
Aug-17
Dec-17
Mar-18
Jun-18
Sep-18
Jan-19
Apr-19
Jul-19
Nov-19
Feb-20
May-20
4
Error!
Refer
ence
sourc
Angel Top Picks | June 2020
June 5, 2020
4
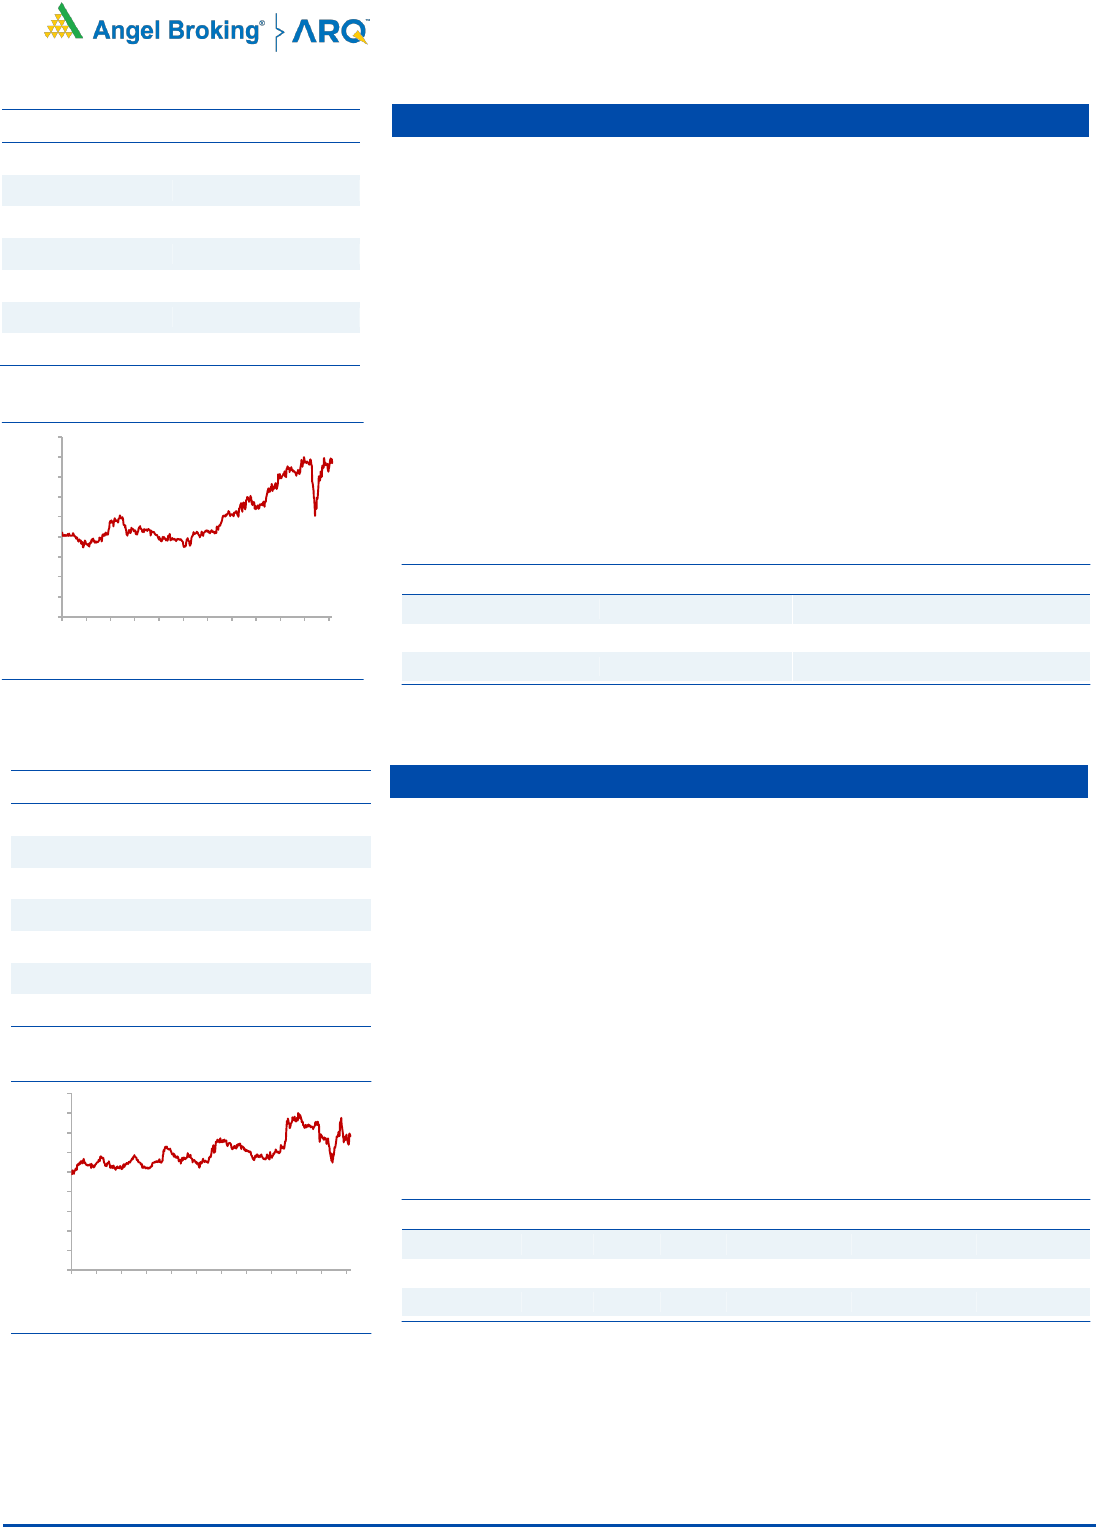
Bharti Airtel
There is going to be some impact on subscribers from the low income group
especially daily wage earners due to the lockdown. However a sharp increase
in data consumption should make up for a significant portion of the loss.
Therefore we expect limited impact on Bharti from the lockdown.
Bharti has raised capital of USD 2bn from a QIP at `445 per share along with
FCCB issues of USD 1bn in January 2020. Therefore Bharti is much better
placed as compared to Vodafone Idea in terms of liquidity.
Telecom operators have increased tariffs by ~35% in Nov’19. There is a
possibility of another round of tariff hikes by telecom companies in FY21 given
that tariffs are still very low. If this were to happen then it would lead to further
upsides to our estimates for FY21 and FY22.
Even if there is no major tariff hike in FY21 and Vodafone Idea goes out of
business, Bharti would benefit significantly from addition of subscribers.
Key Financials
Y/E
Sales
OPM
PAT
EPS
ROE
P/E
P/BV
EV/Sales
March
(` cr)
(%)
(` cr)
(`)
(%)
(x)
(x)
(x)
FY2021E
101322
43.1
4046
5.5
3.6
101.8
3.7
3.7
FY2022E
114360
44.4
8056
12.5
7.7
44.7
3.4
3.1
Source: Company, Angel Research
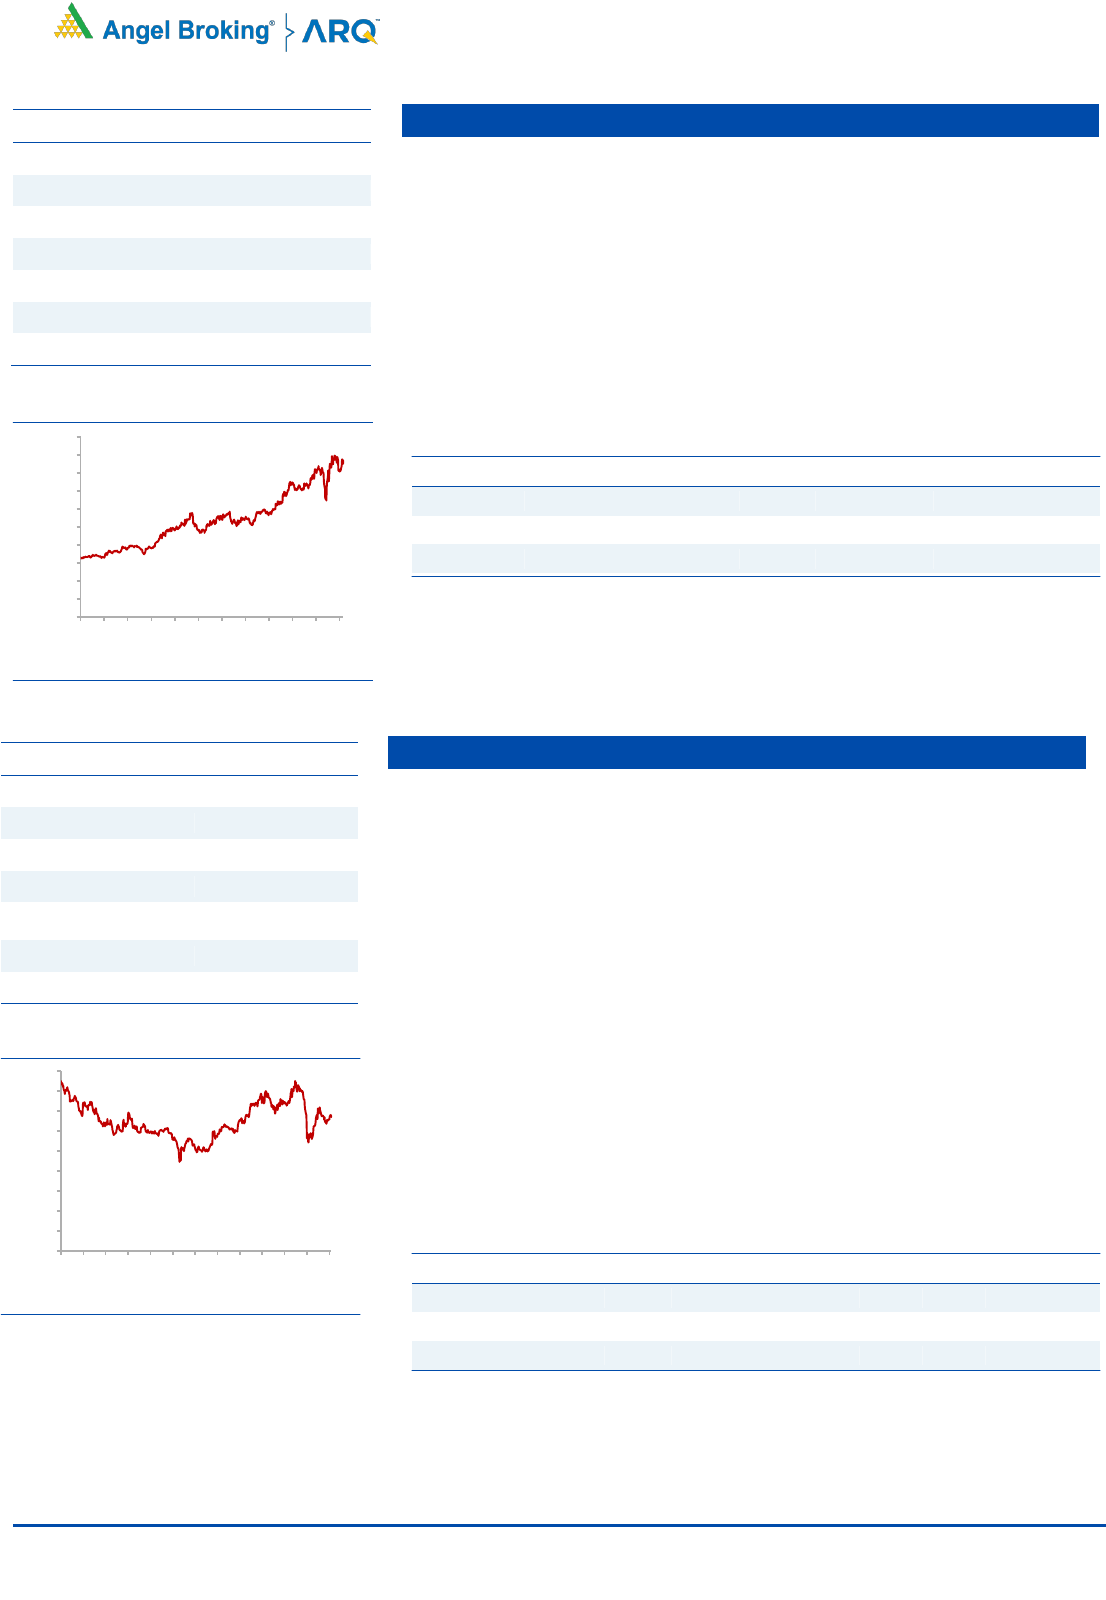
Larsen & Toubro
L&T is India’s largest EPC Company with a strong presence across various
verticals including Infra, Hydrocarbon and services segment. The company
also has a very strong presence in the IT services and NBFC space through its
various subsidiary companies which are also growth drivers for the company.
The company has a strong order backlog of ~INR 3lakh cr. Majority of the
order book is from the central government, state government and PSU, where
risk of cancellation is low.
On the macro front it seems that the covid 19 situation is well under control in
Europe, while the worst of the outbreak seems to be behind for the US which is
leading to a risk on rally globally. We therefore feel that while there will be
near term challenges for the company in terms of order flow and execution,
the stock is trading at significant discount to historical average valuations and
offers favorable risk reward from current levels given global tailwinds.
Key Financials
Y/E
Sales
OPM
PAT
EPS
ROE
P/E
P/BV
EV/Sales
March
(` cr)
(%)
(` cr)
(`)
(x)
(%)
(%)
(x)
FY2021E
62140
6.1
3589
24.8
5.8
38.1
1.9
2.8
FY2022E
85369
9.7
7605
54.2
10.8
17.4
1.8
2.0
Source: Company, Angel Research (Above are standalone numbers)
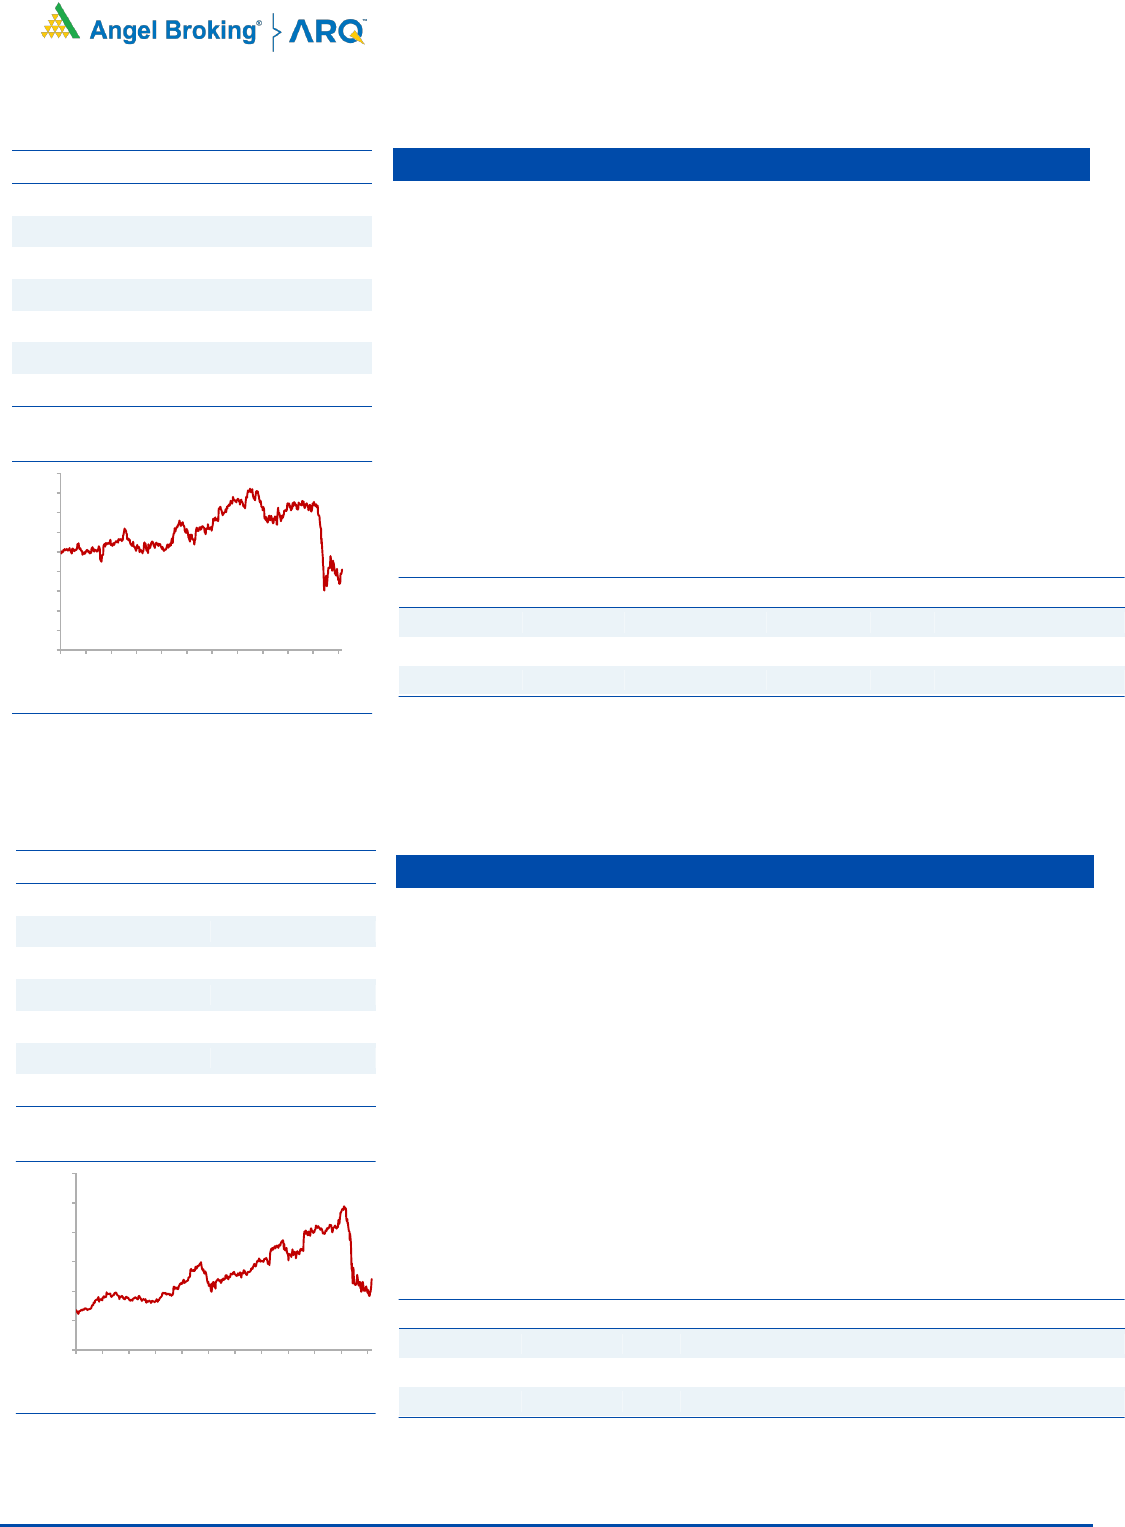
Stock Info
CMP
945
TP
1,093
Upside
15.7%
Sector
Infrastructure
Market Cap (` cr)
132,723
Beta
1.1
52 Week High / Low
1,591/661
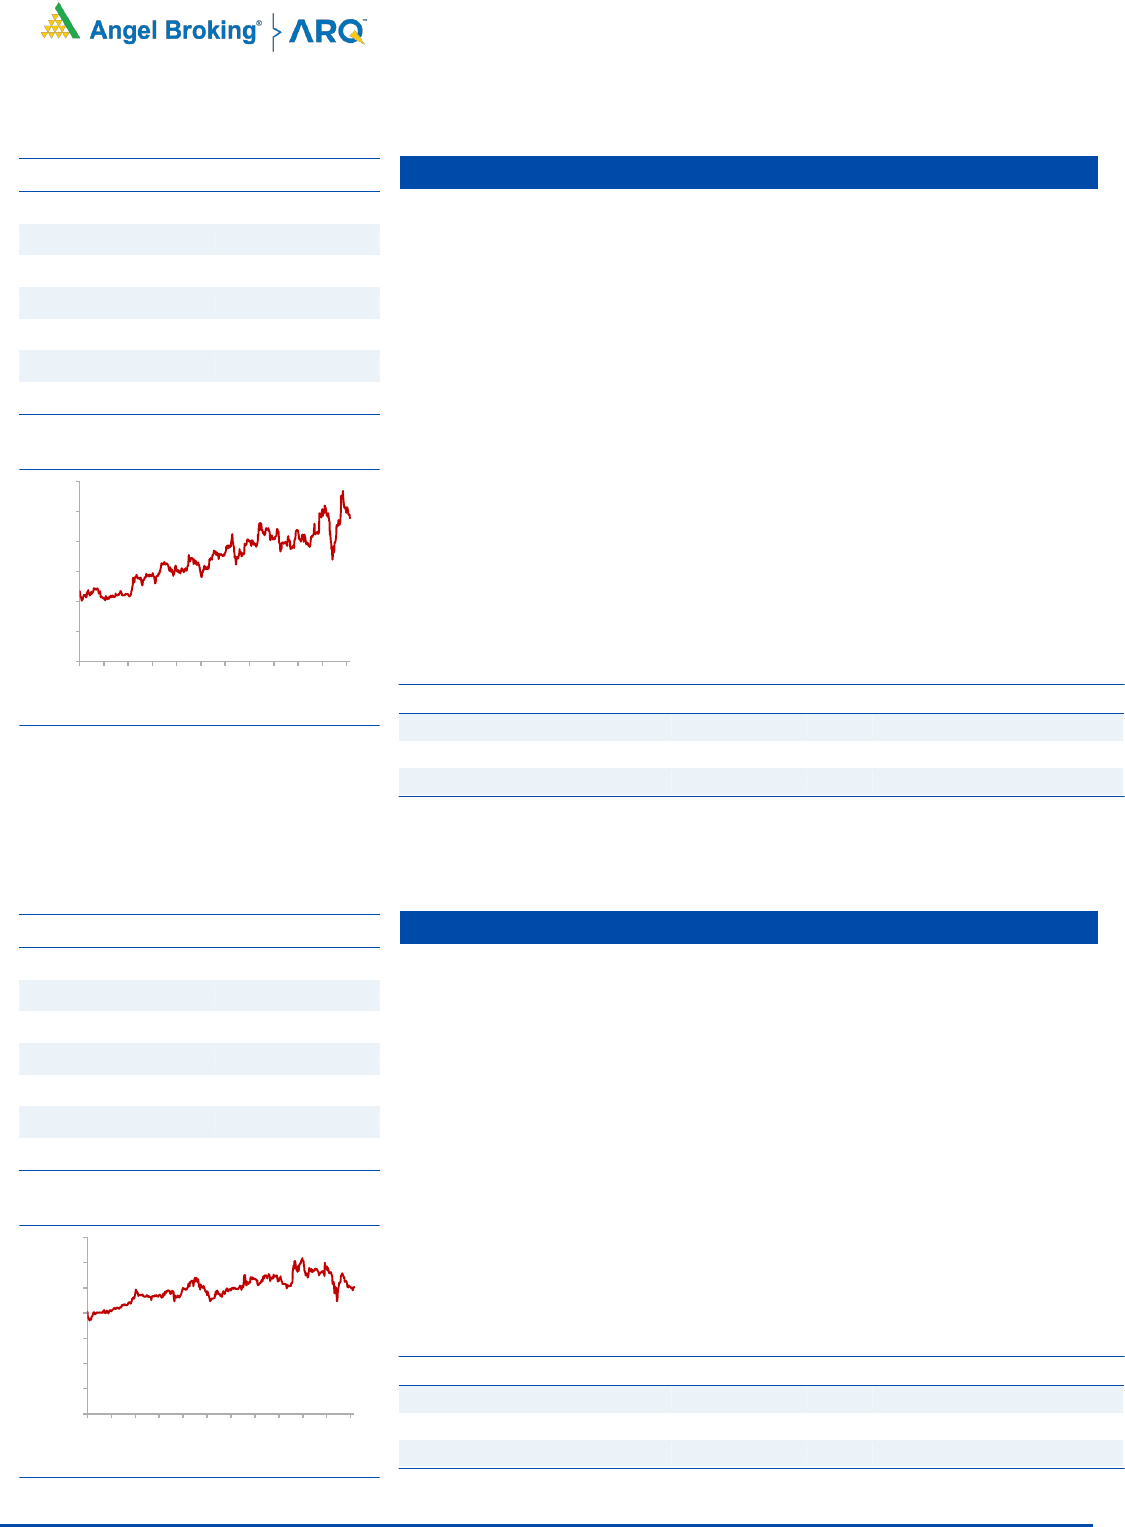
3 year-Chart
Source: Company, Angel Research
-
200
400
600
800
1,000
1,200
1,400
1,600
1,800
May-17
Aug-17
Dec-17
Mar-18
Jun-18
Sep-18
Jan-19
Apr-19
Jul-19
Nov-19
Feb-20
May-20
Stock Info
CMP
558
TP
672
Upside
20.4%
Sector
Telecom
Market Cap (` cr)
304,420
Beta
0.8
52 Week High / Low
611/321
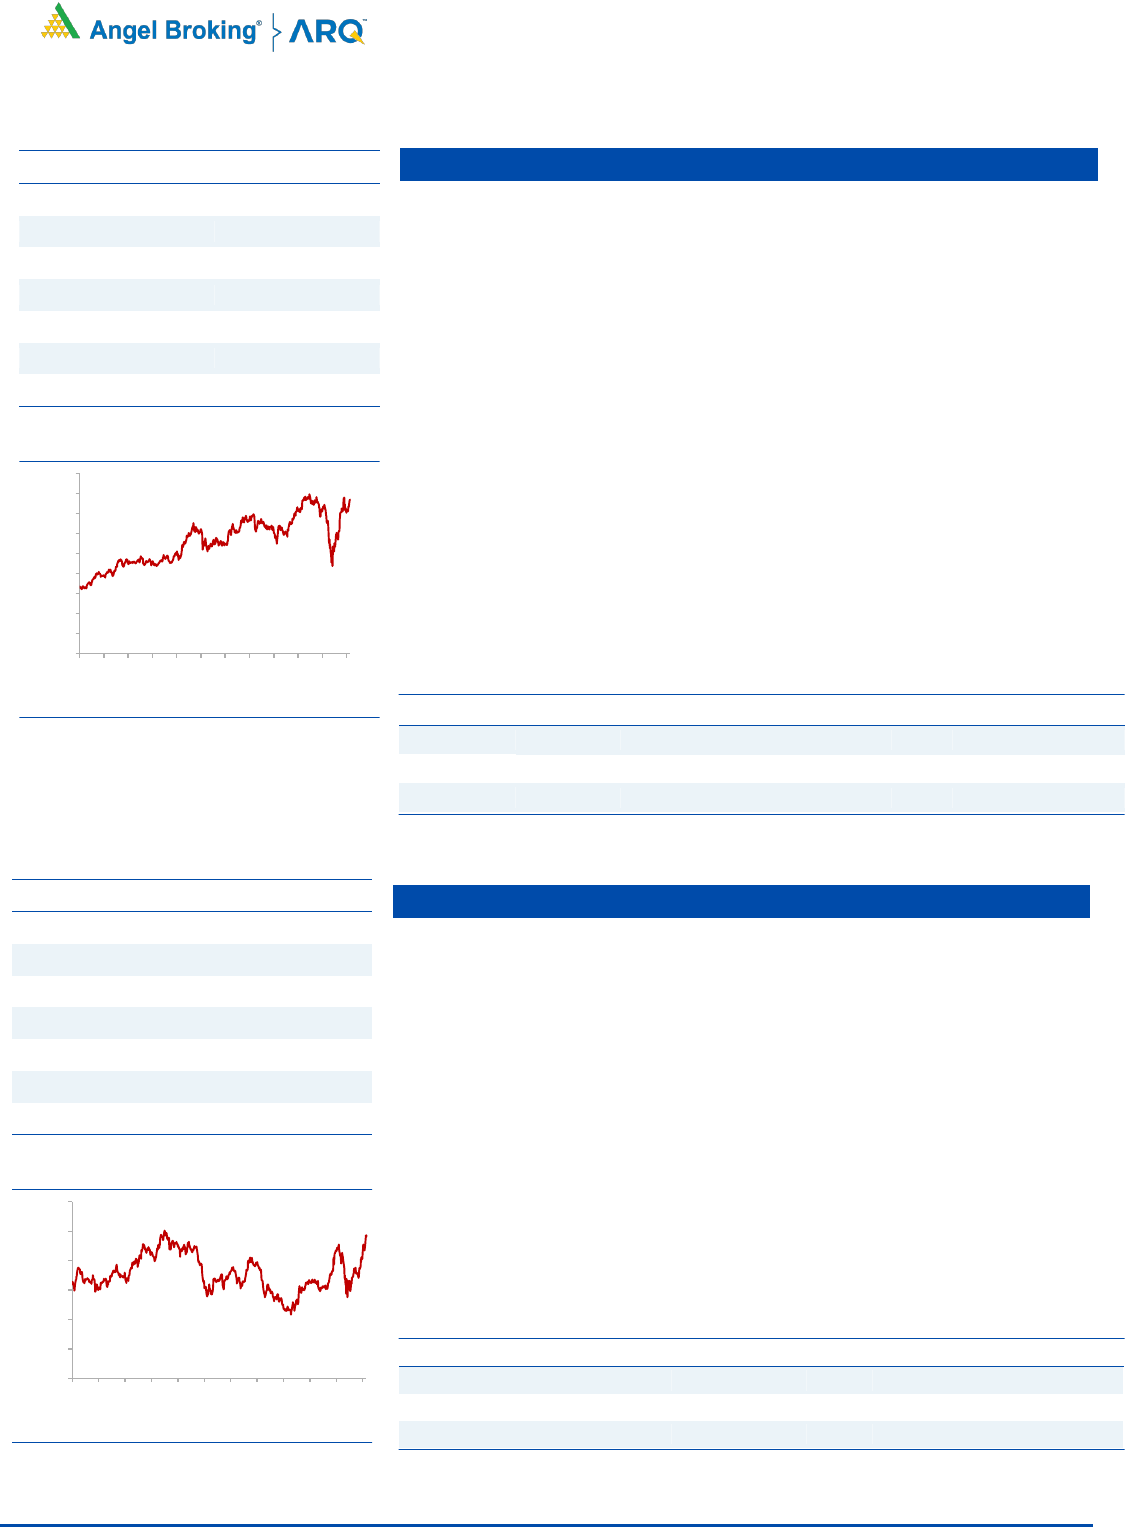
3 year-Chart
Source: Company, Angel Research
-
100
200
300
400
500
600
700
May-17
Aug-17
Dec-17
Mar-18
Jun-18
Sep-18
Jan-19
Apr-19
Jul-19
Nov-19
Feb-20
May-20
5
Error!
Refer
ence
sourc
Angel Top Picks | June 2020
June 5, 2020
5
PI Industries Ltd.
PI Industries is a leading player in providing Custom synthesis and
manufacturing solutions (CSM) to global agrochemical players. The CSM
business accounted for 66% of the company’s revenues in FY19 and is
expected to be the key growth driver for the company in future
The company has been increasing its share of high margin CSM business
driven by strong relationship with global agrochemical players. PI is leveraging
its chemistry skill sets and is looking to diversify its CSM portfolio to electronic
chemicals, Pharma API, fluoro chemicals, etc. which will help drive business.
Though the company’s operations have been impacted due to the Covid-19
outbreak we expect that PI Industries would be amongst the least impacted in
the sector given that the company is a pure play agrochemical player which
are part of essential commodities.
Key Financials:
Y/E
Sales
OPM
PAT
EPS
ROE
P/E
P/BV
EV/Sales
March
(` cr)
(%)
(` cr)
(`)
(%)
(x)
(x)
(x)
FY2021E
3,877
21.5
555
40.2
17.4
38.7
3.4
5.4
FY2022E
4,992
22.5
770
55.8
20.0
27.9
2.8
4.2
Source: Company, Angel Research
Colgate-Palmolive (India)
Colgate-Palmolive India Ltd (CPIL) is engaged in manufacturing & selling of
oral care products such as toothpastes and toothbrushes.
CPIL has leadership position in both toothpastes (52% market share) and
toothbrushes (45% market share).
CPIL continuously invests on ad-spends to strengthen the Colgate brand.
Colgate is India’s No. 1 Most Trusted Oral Care Brand.
CPIL has increased its distribution 2.3x over the last 6-7 years and is
continuously making efforts to deepen its penetration.
We believe that CPIL should ultimately be able to see sharper market share
gain in toothpastes segment on the back of higher ad-spend and re-launch of
Colgate Strong Teeth (decent traction seen in last quarter).
Key Financials
Y/E
Sales
OPM
PAT
EPS
ROE
P/E
P/BV
EV/Sales
March
(` cr)
(%)
(` cr)
(`)
(%)
(x)
(x)
(x)
FY2021E
4566
26.6
786
28.9
37.6
47.3
17.8
8.0
FY2022E
4931
27.9
900
33.1
36.8
41.3
15.2
7.4
Source: Company, Angel Research
Stock Info
CMP
1,365
TP
1,620
Upside
18.6%
Sector
FMCG
Market Cap (` cr)
37,120
Beta
0.5
52 Week High / Low
1,641/1,065
3 year-Chart
Source: Company, Angel Research
-
200
400
600
800
1,000
1,200
1,400
1,600
1,800
May-17
Aug-17
Dec-17
Mar-18
Jun-18
Sep-18
Jan-19
Apr-19
Jul-19
Nov-19
Feb-20
May-20
Stock Info
CMP
1,557
TP
1,785
Upside
14.6%
Sector
Agro Chemicals
Market Cap (` cr)
21,525
Beta
0.7
52 Week High / Low
1,642/973
3 year-Chart
Source: Company, Angel Research
-
200
400
600
800
1,000
1,200
1,400
1,600
1,800
May-17
Aug-17
Dec-17
Mar-18
Jun-18
Sep-18
Jan-19
Apr-19
Jul-19
Nov-19
Feb-20
May-20
6
Error!
Refer
ence
sourc
Angel Top Picks | June 2020
June 5, 2020
6
Nestle (India)
Nestle India Ltd (Nestle) manufactures and sells a variety of food products
such as Milk & Nutrition, Prepared Dishes & Cooking Aids, Powdered & Liquid
Beverages and Confectionery.
Nestle enjoys market leadership position in ~85% of its Portfolio. Nestle has
wide distribution network (4.6mn outlets) across India and strong brand recall.
Strong balance sheet coupled with free cash flow and higher profitability.
Going forward, we expect healthy growth and profitability on the back of
strong brand, wide distribution network and new product launches.
Key Financials
Y/E
Sales
OPM
PAT
EPS
ROE
P/E
P/BV
EV/Sales
March
(` cr)
(%)
(` cr)
(`)
(x)
(%)
(%)
(x)
CY2020E
13235
22.7
2091
216.9
34.9
80.3
28.0
12.2
CY2021E
14558
23.3
2333
242.0
31.3
72.0
22.5
11.0
Source: Company, Angel Research
Galaxy Surfactants
Galaxy Surfactants is a market leader in oleo chemical-based surfactants,
which is used in personal and home care products including skin care, oral
care, hair care, cosmetics, toiletries and detergent products.
The company has been increasing its share of high margin specialty care
products in its portfolio which now accounts for ~ 40% of its revenues while
the balance is accounted for by the performance surfactant business.
Company has very strong relationship with MNC clients like Unilever, P&G,
Henkel, Colgate-Palmolive and supplies raw materials to them not only in
India but also in US, EU and MENA region.
Though the company’s operations have been impacted due to the Covid-19
outbreak we expect that Galaxy Surfactants would be amongst the least
impacted in the sector given the company’s exposure to the personal and
home care segment.
Key Financials
Y/E
Sales
OPM
PAT
EPS
ROE
P/E
P/BV
EV/Sales
March
(` cr)
(%)
(` cr)
(`)
(%)
(x)
(x)
(x)
FY2021E
2,672
14.0
221
62.2
0.2
21.7
4.0
1.8
FY2022E
2,886
14.3
223
62.8
0.2
19.4
3.5
1.7
Source: Company, Angel Research
Stock Info
CMP
1,360
TP
1,610
Upside
18.4%
Sector
Chemicals
Market Cap (` cr)
4,823
Beta
0.6
52 Week High / Low
1,790/975
3 year-Chart
Source: Company, Angel Research
-
200
400
600
800
1,000
1,200
1,400
1,600
1,800
Feb-18
Apr-18
Jun-18
Sep-18
Nov-18
Jan-19
Apr-19
Jun-19
Aug-19
Oct-19
Jan-20
Mar-20
May-20
Stock Info
CMP
17,020
TP
20,687
Upside
21.5%
Sector
FMCG
Market Cap (` cr)
164,108
Beta
0.6
52 Week High / Low
18,301/11,270
3 year-Chart
Source: Company, Angel Research
-
2,000
4,000
6,000
8,000
10,000
12,000
14,000
16,000
18,000
20,000
May-17
Aug-17
Dec-17
Mar-18
Jun-18
Sep-18
Jan-19
Apr-19
Jul-19
Nov-19
Feb-20
May-20
7
Error!
Refer
ence
sourc
Angel Top Picks | June 2020
June 5, 2020
7
IPCA Laboratories
IPCA’s 54% of revenue comes from domestic generic and API business.
Generics and API continues to provide revenue growth for Ipca. Expected to
outperform the Indian Pharmaceutical market (IPM) by 8%-10% p.a in FY 22.
EU generic & branded which account for 15% of the company’s revenues are
on growth trajectory along with higher margins (40% EBITDA margins).
Current capacity utilization of plants which supply to Europe is at 20% which is
expected to ramp up from current levels. We expect the European business to
show 30-35% PAT growth.
Ipca manufacture over 350 formulations and 80 APIs for various therapeutic
segments like Pain management. Currently the company has 18 ANDA
sapprovals, 46 ANDA filled with authorities while 8 products are in clinical
trials.
Britannia Industries
Britannia Industries (BRIT)’s principal activity is manufacture and sale of
biscuits, bread, rusk, cakes and dairy products.
BRIT has brands like Tiger, Good-Day, and 50:50 under its fold with an
estimated market share of 33% in the Indian biscuits industry. Biscuits
contribute more than 80% of the company’s turnover.
BRIT has an overall distribution reach of 5.5 million outlets. With consistent
focus on distribution expansion, BRIT has narrowed the gap with the No. 1
player. The gap with largest distributed brand is now just 0.8 million outlets.
In Q4FY20 BRIT have outperformed other companies in FMCG space with
YOY growth of 2.5%/20bp/27% in Revenue/EBITDA/PAT respectively. Going
ahead in near term, food industry is witnessing a shift from dining out/ street
food to home consumption. BRIT being a low price product with trusted brands
is well positioned to cater the shift.
Stock info
CMP
1,555
TP
1,900
Upside
22.2%
Sector
Pharma
Market Cap (` cr)
19,655
Beta
0.3
52 Week High / Low
1,821/844
3 year-Chart
Source: Company, Angel Research
Key Financials
Y/E
Sales
OPM
PAT
EPS
ROE
P/E
P/BV
EV/Sales
March
(` cr)
(%)
(` cr)
(`)
(%)
(x)
(x)
(x)
FY2021E
5360
22.5
821
65.7
18.8
23.7
4.6
3.9
FY2022E
6111
23.0
976
78.1
18.6
19.9
3.9
3.4
Source: Company, Angel Research
Stock Info
CMP
3,450
TP
3,920
Upside
13.6%
Sector
FMCG
Market Cap (` cr)
82,968
Beta
0.9
52 Week High / Low
3,479/2,100
3 year-Chart
Source: Company, Angel Research
Key Financials
Y/E
Sales
OPM
PAT
EPS
ROE
P/E
P/BV
EV/Sales
March
(` cr)
(%)
(` cr)
(`)
(%)
(x)
(x)
(x)
FY2021E
13,142
15.7
1536.5
63.9
29.5
54
18.8
6.7
FY2022E
14,587
15.7
1713.7
71.3
28.6
48.4
15.6
6.0
Source: Company, Angel Research
-
200
400
600
800
1,000
1,200
1,400
1,600
1,800
May-17
Aug-17
Dec-17
Mar-18
Jun-18
Sep-18
Jan-19
Apr-19
Jul-19
Nov-19
Feb-20
May-20
-
500
1,000
1,500
2,000
2,500
3,000
3,500
4,000
May-17
Aug-17
Dec-17
Mar-18
Jun-18
Sep-18
Jan-19
Apr-19
Jul-19
Nov-19
Feb-20
May-20
8
Error!
Refer
ence
sourc
Angel Top Picks | June 2020
June 5, 2020
8
HDFC Ltd.
HDFC has sufficient capital (Tier-1 -16.6%) and Liquidity (Rs.30,000cr) to tide
over this situation.
HDFC’s superior know how of the segment; strict underwriting practices and
buffer provision would help it to better manage the credit loss
As per NHB norms, HDFC is required to carry total provision of Rs. 4,188
crore, against which actual provisions as of Q4FY2020 were at Rs. 10,988
crore, which is over and above regulatory requirement and provides investor
comfort.
HDFC is currently available at ~1.7x its FY2022E BV, which we believe is
reasonable considering its robust operating metrics, experience management,
Healthy provision and sustainable business model.
Infosys
Infosys is amongst the top three IT services company based out of India and
provides a vast gamut of services like ADM, Enterprise solutions, Infrastructure
management services etc.
Under the new management of Mr. Salil Parekh Infosys has become
aggressive in terms of signing new deals, which is expected to drive growth for
the company. New deal wins has clearly accelerated with the company
winning deals worth USD 6.3bn and USD 9.0bn in FY19 & FY20 respectively
as against deal wins of USD 3.1bn in FY18.
We expect the company to post revenue/EBITDA/PAT growth of
7.5%/3.7%/5.1% between FY19-FY22 despite Covid-19 outbreak affecting
FY21 numbers. Rupee depreciation from ~71 levels to ~76 to the US dollar
will have a positive impact on top line and bottom-line and will mitigate the
adverse impact due to Covid-19 outbreak to a large extent.
Stock Info
CMP
1,815
TP
2,000
Upside
10.2%
Sector
Banking
Market Cap (` cr)
314,323
Beta
1.3
52 Week High / Low
2,500/1,473
3 year-Chart
Source: Company, Angel Research
Key Financials
Y/E
Op. Inc
NIM
PAT
EPS
ABV
ROA
ROE
P/E
P/ABV
March
(` cr)
(%)
(` cr)
(`)
(`)
(%)
(%)
(x)
(x)
FY2021E
12,216
3.4
7,978
46
543
1.4
10
39
3.3
FY2022E
13,421
3.4
10,260
59
590
1.7
12
31
3.1
Source: Company, Angel Research
Stock Info
CMP
708
TP
841
Upside
18.8%
Sector
IT
Market Cap (` cr)
301,566
Beta
0.8
52 Week High / Low
847/511
3 year-Chart
Source: Company, Angel Research
Key Financials
Y/E
Sales
OPM
PAT
EPS
ROE
P/E
P/BV
EV/Sales
March
(` cr)
(%)
(` cr)
(`)
(%)
(x)
(x)
(x)
FY2021E
90,650
21.3
16,200
38.2
28.1
18.3
5.0
2.8
FY2022E
1,02,857
20.5
17,870
42.1
30.5
16.6
4.7
2.5
Source: Company, Angel Research
-
500
1,000
1,500
2,000
2,500
3,000
May-17
Aug-17
Dec-17
Mar-18
Jun-18
Sep-18
Jan-19
Apr-19
Jul-19
Nov-19
Feb-20
May-20
-
100
200
300
400
500
600
700
800
900
May-17
Aug-17
Dec-17
Mar-18
Jun-18
Sep-18
Jan-19
Apr-19
Jul-19
Nov-19
Feb-20
May-20
9
Error!
Refer
ence
sourc
Angel Top Picks | June 2020
June 5, 2020
9
Aarti Industries
Aarti Industries is the lowest cost producer in Benzene based derivatives.
Company accounts for 20% of world’s Nitrochloro Benzene (NCB) and 10% of
dichloride benzene (DCB) capacity.
Company has been constantly increasing its share of high margin downstream
products which now accounts for 70% of the company’s revenues. Company is
expanding its NCB capacity which would be utilized for manufacture of high
margins downstream products.
Company is well diversified across product, customer, geography and end
user industry and is not likely to be impacted too much from the Covid-19
outbreak. Exports account for 40% of revenues while balance 60% is from
domestic sales. Significant opportunity for company arising from
environmental related issues in China and companies looking to diversify
supply chains.
P&G Hygiene & Healthcare Ltd.
P&GHH manufactures, distributes and markets three major brands in India –
Whisper (sanitary napkins), Vicks (balm, cough drops and tablets), and Old
Spice (aftershave lotion and deodorants).
Whisper being market leader with market share of 56% in Sanitary pad
segment contributes ~69% of total revenue. Sanitary Pads having less than
20% market penetration leaves immense growth opportunity for Whisper. icks
beings market leader with market share of ~30% contributes 30% of Total
Revenue.
Going forward, we expect healthy growth and profitability on the back of
strong brand, wide distribution network and new product launches.
Stock Info
CMP
974
TP
1,284
Upside
31.8%
Sector
Chemicals
Market Cap (` cr)
18,965
Beta
0.8
52 Week High / Low
1,192/662
3 year-Chart
Source: Company, Angel Research
Key Financials
Y/E
Sales
OPM
PAT
EPS
ROE
P/E
P/BV
EV/Sales
March
(` cr)
(%)
(` cr)
(`)
(%)
(x)
(x)
(x)
FY2021E
4822
21.7
538
30.3
16.8
32.2
5.1
3.5
FY2022E
5886
22.2
711
40.1
19.6
24.3
4.4
2.9
Source: Company, Angel Research
Stock Info
CMP
10,032
TP
12,230
Upside
21.9%
Sector
FMCG
Market Cap (` cr)
32,564
Beta
0.4
52 Week High / Low
12,700/8,500
3 year-Chart
Source: Company, Angel Research
Key Financials
Y/E
Sales
OPM
PAT
EPS
ROE
P/E
P/BV
EV/Sales
March
(` cr)
(%)
(` cr)
(`)
(%)
(x)
(x)
(x)
FY2021E
3365
22.2
549.6
169.3
28.0
59.2
15.9
9.4
FY2022E
3803
22.6
637.4
196.4
23.0
51.1
12.0
8.4
Source: Company, Angel Research
-
200
400
600
800
1,000
1,200
May-17
Aug-17
Dec-17
Mar-18
Jun-18
Sep-18
Jan-19
Apr-19
Jul-19
Nov-19
Feb-20
May-20
-
2,000
4,000
6,000
8,000
10,000
12,000
14,000
May-17
Aug-17
Dec-17
Mar-18
Jun-18
Sep-18
Jan-19
Apr-19
Jul-19
Nov-19
Feb-20
May-20
10
Error!
Refer
ence
sourc
Angel Top Picks | June 2020
June 5, 2020
10
Reliance Industries
Reliance Industries Ltd. (RIL) is India’s largest company with dominant
presence in Refining, Petrochemicals, Telecom and Retail businesses.
RIL has built up a dominant telecom business and has already attained market
leader status with 38.3 cr. subscribers at the end of Q4FY20. Telecom
business to witness robust growth over next few years due to tariff hikes and
shift of subscribers from Vodafone Idea to other telecom players.
RIL has also built a very strong retail business which is the largest organized
retailing company in India. We expect the retail business to be a key value
driver for Reliance over the long run though there would be some impact on
business in FY21 due to the Covid-19 outbreak.
Refining and petrochemicals business would be a stable low growth business
for RIL going forward but will be a major cash generator for the company as
there will be negligible capex requirements. The cash flows would be used to
fund expansion into other businesses.
Escorts
Escorts are a prominent tractor player domestically with market share in excess
of 11%. The company’s brand of tractors is particularly strong in the northern
as well as the eastern belt of India.
With rural India relatively less impacted due to Covid-19, record food-grain
procurement by government agencies as well as expectation of normal
monsoon 2020, we expect the tractor industry to outperform the larger
automobile space in FY21E with Escorts a key beneficiary.
Escorts in the recent past has also entered into a strategic partnership with
Kubota Corporation of Japan (one of the global leaders in farm machinery
and implements), which provides further visibility of growth for the company,
going forward.
Stock Info
CMP
1,536
TP
1,748
Upside
13.8%
Sector
Diversified
Market Cap (` cr)
1,038,715
Beta
1.1
52 Week High / Low
1,602/867
3 year-Chart
Source: Company, Angel Research
Key Financials
Y/E
Sales
OPM
PAT
EPS
ROE
P/E
P/BV
EV/Sales
March
(` cr)
(%)
(` cr)
(`)
(%)
(x)
(x)
(x)
FY2021E
3,73,215
13.8
30,272
59.2
6.4
32.2
2.1
5.2
FY2022E
4,57,539
13.3
37,510
47.8
7.8
26.0
2.0
4.3
Source: Company, Angel Research (Above are standalone numbers)
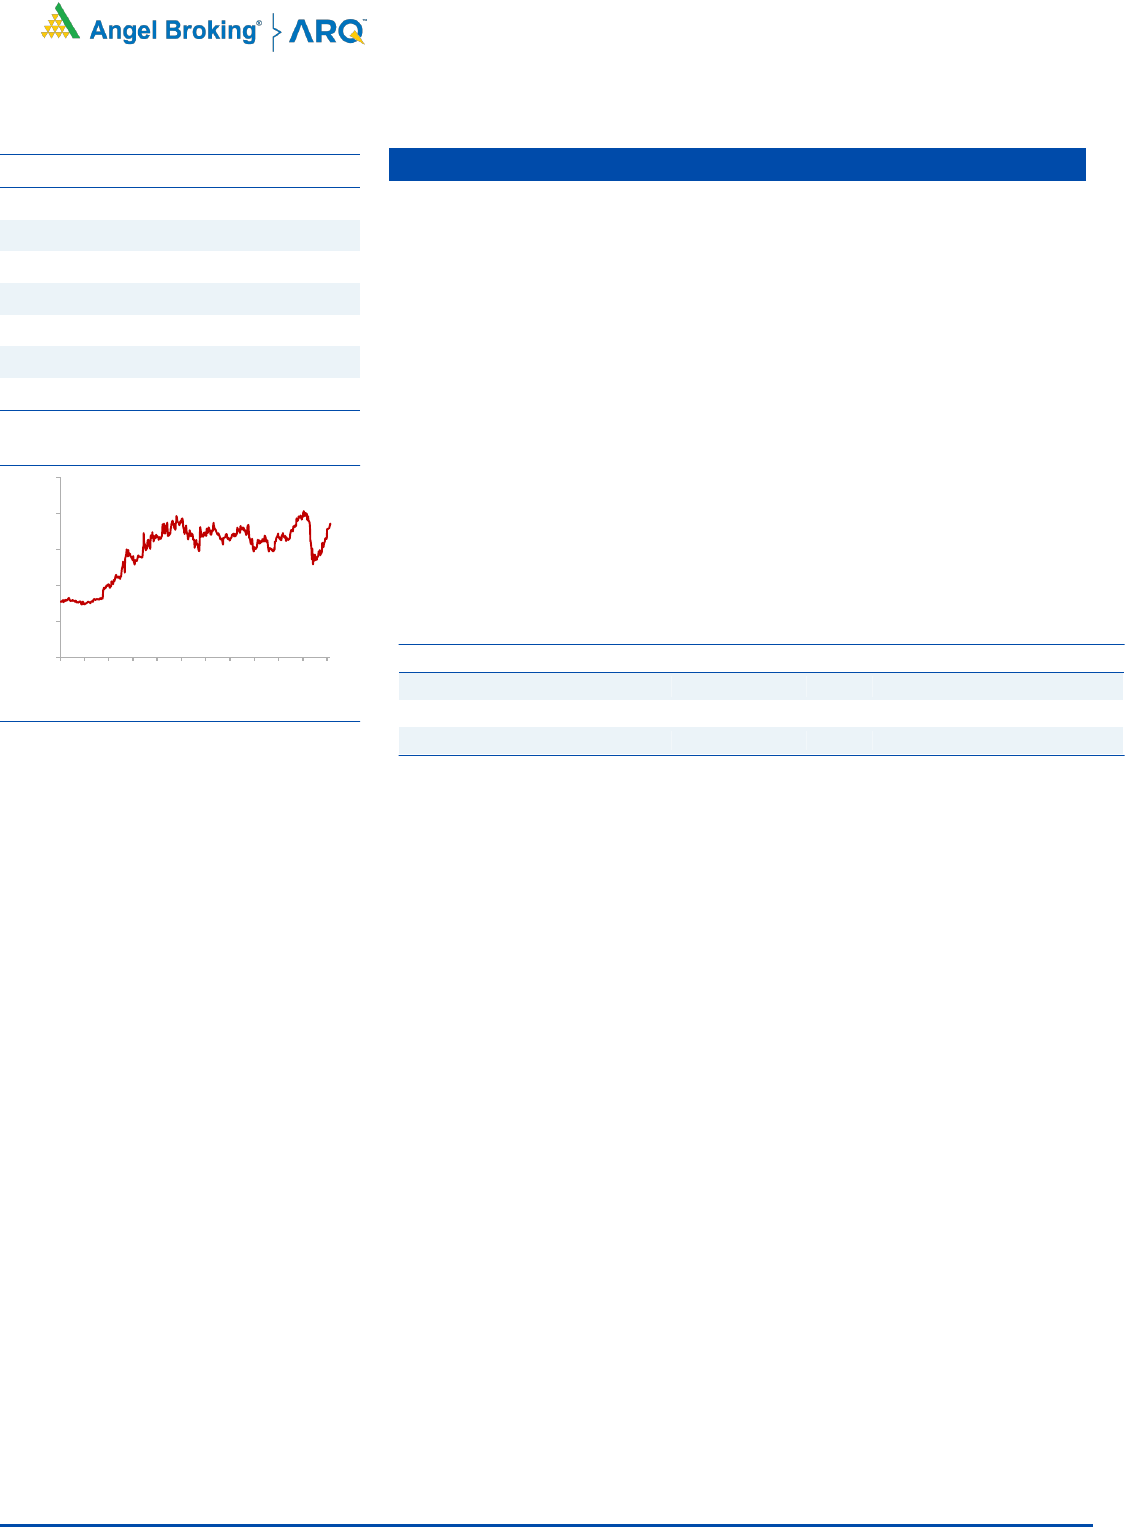
Stock Info
CMP
958
TP
1,150
Upside
20.0%
Sector
Auto
Market Cap (` cr)
11,748
Beta
1.5
52 Week High / Low
986/423
3 year-Chart
Source: Company, Angel Research
Key Financials
Y/E
Sales
OPM
PAT
EPS
ROE
P/E
P/BV
EV/Sales
March
(` cr)
(%)
(` cr)
(`)
(%)
(x)
(x)
(x)
FY2021E
5,880
11
525
42.8
16.8
22.4
3.8
2.1
FY2022E
6,693
11.5
615
50.2
15.6
19.1
3.5
1.9
Source: Company, Angel Research
-
200
400
600
800
1,000
1,200
1,400
1,600
1,800
May-17
Aug-17
Dec-17
Mar-18
Jun-18
Sep-18
Jan-19
Apr-19
Jul-19
Nov-19
Feb-20
May-20
-
200
400
600
800
1,000
1,200
May-17
Aug-17
Dec-17
Mar-18
Jun-18
Sep-18
Jan-19
Apr-19
Jul-19
Nov-19
Feb-20
May-20
11
Error!
Refer
ence
sourc
Angel Top Picks | June 2020
June 5, 2020
11
Hindustan Unilever
HUL is engaged in manufacturing of branded and packaged FMCG products
including soap, detergent, personal care products and processed food. The
company also produces ice creams, cooking oils, fertilizers and hybrid seed
HUL has strong brand recall of its products and HUL has extensive distribution
reach of 7+ million outlets and direct distribution of 3.5+ million retail outlets.
Strong balance sheet along with free cash flow and higher profitability.
Going forward, we expect HUL to report healthy bottom-line growth due to
healthy volume growth on back of strong brand, wide distribution network.
ICICI Bank
The Ability to raise sufficient liquidity at Low cost would be The Key criteria for
banks to navigate the current situation, as asset side inflow would be limited.
ICICI Bank is clearly better positioned in the liability side (in Q4FY20, Deposit
grew 18% yoy and CASA ratio of 45%). Easier and cheaper availability of
deposits gives an advantage to manage ALM given limited inflow from
advance due to moratorium and lower impact on NIM.
Strong liability franchise, Healthy asset mix, higher than 70% provision for bad
asset and More than 80% of incremental lending to high rated corporate
provide comfort.
ICICI Bank is trading (Core Banking Business – 1.1x FY22ABV) at a significant
discount to historical average valuations and offers favourable risk reward
from current levels given global tailwinds.
Stock Info
CMP
2,107
TP
2,364
Upside
12.2%
Sector
FMCG
Market Cap (` cr)
495,120
Beta
0.7
52 Week High / Low
2,614/1,660
3 year-Chart
Source: Company, Angel Research
Key Financials
Y/E
Sales
OPM
PAT
EPS
ROE
P/E
P/BV
EV/Sales
March
(` cr)
(%)
(` cr)
(`)
(%)
(x)
(x)
(x)
FY2021E
40778
24.6
7024
32.5
64.3
63.0
45.6
12.1
FY2022E
44855
24.8
7809
36.2
61.7
56.7
39.4
11.0
Source: Company, Angel Research
Stock Info
CMP
348
TP
410
Upside
17.8%
Sector
Banking
Market Cap (` cr)
225,665
Beta
1.4
52 Week High / Low
552/269
3 year-Chart
Source: Company, Angel Research
Key Financials
Y/E
Op. Inc
NIM
PAT
EPS
ABV
ROA
ROE
P/E
P/ABV
March
(` cr)
(%)
(` cr)
(`)
(`)
(%)
(%)
(x)
(x)
FY2021E
35,063
3.4
8,814
14
176
0.8
7
25
2.0
FY2022E
36,508
3.3
11,909
18
191
1.0
9
19
1.8
Source: Company, Angel Research
-
500
1,000
1,500
2,000
2,500
3,000
May-17
Aug-17
Dec-17
Mar-18
Jun-18
Sep-18
Jan-19
Apr-19
Jul-19
Nov-19
Feb-20
May-20
-
100
200
300
400
500
600
May-17
Aug-17
Dec-17
Mar-18
Jun-18
Sep-18
Jan-19
Apr-19
Jul-19
Nov-19
Feb-20
May-20
12
Error!
Refer
ence
sourc
Angel Top Picks | June 2020
June 5, 2020
12
Axis Bank
The Ability to raise sufficient liquidity at Low cost would be The Key criteria for
banks to navigate the current situation, as asset side inflow would be limited.
Bank is witnessing higher deposit growth in last 2 qtr, which clearly shows
increasing deposit polarisation.
Axis Bank have a healthy asset mix, superior customer profile, liability strength
and capital comfort that is well suited to ride this challenging period.
Axis Bank is trading (Core Banking Business – 1.2x FY22ABV) at a significant
discount to historical average valuations and offers favorable risk reward from
current levels given global tailwinds.
Bajaj Finance
We remain convinced of the strength of BAF’s business model. In this scenario
BAFIN is able to manage raise fund at competitive rate.
27% of AUM has opted under moratorium, However, 68% of this have no
recent bounce history
High Capital (Tier -21.2%) and sufficient liquidity in balance sheet help then to
sail through tough time, better than other NBFC
Considering, above positive and lower valuation than historical average, we
recommend buy on Bajaj finance
Stock Info
CMP
410
TP
500
Upside
21.9%
Sector
Banking
Market Cap (` cr)
119,623
Beta
1.5
52 Week High / Low
826/285
3 year-Chart
Source: Company, Angel Research
Key Financials
Y/E
NII
NIM
PAT
EPS
ABV
ROA
ROE
P/E
P/ABV
March
(`cr)
(%)
(` cr)
(`)
(`)
(%)
(%)
(x)
(x)
FY2021E
26,400
3.1
5,390
19
314
0.6
6
21
1.31
FY2022E
28,698
3.2
6,678
24
335
0.7
7
17
1.22
Source: Company, Angel Research
Stock Info
CMP
2,346
TP
3,000
Upside
27.8%
Sector
NBFC
Market Cap (` cr)
148,256
Beta
1.4
52 Week High / Low
4,923/1,783
3 year-Chart
Source: Company, Angel Research
Key Financials
Y/E
NII
NIM
PAT
EPS
ABV
ROA
ROE
P/E
P/ABV
March
(` cr)
(%)
(`cr)
(`)
(`)
(%)
(%)
(x)
(x)
FY2021E
13,977
9.0
5,182
86
615
3.2
15
28
4.0
FY2022E
15,571
9.5
7,250
121
722
4.2
18
20
3.4
Source: Company, Angel Research
-
100
200
300
400
500
600
700
800
900
May-17
Aug-17
Dec-17
Mar-18
Jun-18
Sep-18
Jan-19
Apr-19
Jul-19
Nov-19
Feb-20
May-20
-
1,000
2,000
3,000
4,000
5,000
6,000
May-17
Aug-17
Dec-17
Mar-18
Jun-18
Sep-18
Jan-19
Apr-19
Jul-19
Nov-19
Feb-20
May-20
13
Error!
Refer
ence
sourc
Angel Top Picks | June 2020
June 5, 2020
13
L&T Infotech
L&T InfoTech (LTI) is one of the fastest growing mid cap IT Company in India.
IT is part of the L&T group and provides services like ADM, Enterprise
solutions, Infrastructure management services etc.
Company has a very strong presence to the BFSI & manufacturing verticals,
which accounts for ~45% and 17.5% of the company’s revenues and are
amongst the least impacted vertical due to the shutdown on account of Covid -
19. The company doesn't have a very large exposure to service oriented
verticals like travel & Tourism which are amongst the worst impacted due to
the Covid – 19 outbreak.
LTI has been growing significantly faster than both mid and large cap peers
have over the past few years on the back of strong deal wins and we expect
the outperformance to continue for the company.
Stock Info
CMP
1,852
TP
2,145
Upside
15.8%
Sector
IT
Market Cap (` cr)
32,255
Beta
0.7
52 Week High / Low
2,050/1207
3 year-Chart
Source: Company, Angel Research
Key Financials
Y/E
Sales
OPM
PAT
EPS
ROE
P/E
P/BV
EV/Sales
March
(` cr)
(%)
(` cr)
(`)
(%)
(x)
(x)
(x)
FY2021E
11,588
18.9
1,611
92.6
0.2
20.0
4.6
2.5
FY2022E
13,085
19.6
1,867
107.3
0.2
17.3
3.9
2.1
Source: Company, Angel Research
-
500
1,000
1,500
2,000
2,500
May-17
Aug-17
Dec-17
Mar-18
Jun-18
Sep-18
Jan-19
Apr-19
Jul-19
Nov-19
Feb-20
May-20

14
Error!
Refer
ence
sourc
Angel Top Picks | June 2020
June 5, 2020
14
Changes in Recommendation
Exhibit 1: Stocks on Hold
Stock name
Hold Date
Hold Price
Jindal Steel
05-10-2019
94
Source: Company, Angel Research
Hold – While we recommend to Hold on to existing positions at current level, we would await
for further data points before recommending any fresh purchases.
Exhibit 2: Stocks bought in last 6-months
Stock Name
Buy Call Date
Buy Price
Hawkins Cookers
09-01-2020
3,591
Asian Paints
11-03-2020
1,864
Bata India
13-03-2020
1,411
Hind. Unilever
30-03-2020
2,141
Avenue Super.
30-03-2020
2,028
Colgate-Palm.
30-03-2020
1,164
Nestle India
30-03-2020
15,110
Dr Lal Pathlabs
01-04-2020
1,384
P & G Hygiene
01-04-2020
10,161
Ipca Labs.
01-04-2020
1,398
Bharti Airtel
01-04-2020
421
Dabur India
16-04-2020
498
L & T Infotech
16-04-2020
1,493
Infosys
16-04-2020
625
Britannia Inds.
16-04-2020
2,832
Alkem Lab
17-04-2020
2,687
Reliance Inds.
17-04-2020
1,189
P I Inds.
24-04-2020
1,506
Galaxy Surfact.
24-04-2020
1,394
Aarti Inds.
24-04-2020
929
Dhanuka Agritech
07-05-2020
438
Hind. Unilever
08-05-2020
2,056
Dr Reddy's Labs
28-05-2020
3,877
H D F C
01-06-2020
1,740
Larsen & Toubro
01-06-2020
951
Escorts
01-06-2020
970
ICICI Bank
01-06-2020
345
Axis Bank
03-06-2020
424
Bajaj Fin.
03-06-2020
2,477
Source: Company, Angel Research

15
Error!
Refer
ence
sourc
Angel Top Picks | June 2020
June 5, 2020
15
Exhibit 3: Stocks sold in last 6-months
Stock Name
Sell Date
Sell Price
Ashok Leyland
05-12-2019
79
Blue Star
06-12-2019
813
HDFC Bank
21-01-2020
1,246
Siyaram Silk
27-01-2020
229
Maruti Suzuki
28-01-2020
7,065
Music Broadcast
29-01-2020
28
GIC Housing Fin
30-01-2020
153
Parag Milk Foods
01-02-2020
137
Bata India
07-02-2020
1,880
Larsen & Toubro
25-02-2020
1,249
Aditya Birla Cap
06-03-2020
75
Dr Lal Pathlabs
09-04-2020
1,462
RBL Bank
15-04-2020
121
Shriram Trans.
15-04-2020
685
KEI Inds.
16-04-2020
279
Safari Inds.
16-04-2020
402
Amber Enterp.
16-04-2020
1,116
UltraTech Cem.
21-04-2020
3,409
Inox Wind
24-04-2020
26
Hind. Unilever
04-05-2020
2,121
ICICI Bank
05-05-2020
341
Dabur India
06-05-2020
450
Asian Paints
07-05-2020
1,610
Hawkins Cookers
22-05-2020
4,235
Bata India
26-05-2020
1,265
GMM Pfaudler
26-05-2020
3,732
Alkem Lab
27-05-2020
2,425
Dhanuka Agritech
27-05-2020
573
Source: Company, Angel Research

16
Error!
Refer
ence
sourc
Angel Top Picks | June 2020
June 5, 2020
16
Research Team Tel: 022 - 39357800 E-mail: [email protected] Website: www.angelbroking.com
DISCLAIMER
Angel Broking Limited (hereinafter referred to as “Angel”) is a registered Member of National Stock Exchange of India Limited, Bombay
Stock Exchange Limited, Metropolitan Stock Exchange Limited, Multi Commodity Exchange of India Ltd and National Commodity &
Derivatives Exchange Ltd It is also registered as a Depository Participant with CDSL and Portfolio Manager and Investment Adviser with
SEBI. It also has registration with AMFI as a Mutual Fund Distributor. Angel Broking Limited is a registered entity with SEBI for Research
Analyst in terms of SEBI (Research Analyst) Regulations, 2014 vide registration number INH000000164. Angel or its associates has not
been debarred/ suspended by SEBI or any other regulatory authority for accessing /dealing in securities Market. Angel or its
associates/analyst has not received any compensation / managed or co-managed public offering of securities of the company covered
by Analyst during the past twelve months.
This document is solely for the personal information of the recipient, and must not be singularly used as the basis of any investment
decision. Nothing in this document should be construed as investment or financial advice. Each recipient of this document should
make such investigations as they deem necessary to arrive at an independent evaluation of an investment in the securities of the
companies referred to in this document (including the merits and risks involved), and should consult their own advisors to determine
the merits and risks of such an investment.
Reports based on technical and derivative analysis center on studying charts of a stock's price movement, outstanding positions and
trading volume, as opposed to focusing on a company's fundamentals and, as such, may not match with a report on a company's
fundamentals. Investors are advised to refer the Fundamental and Technical Research Reports available on our website to evaluate the
contrary view, if any
The information in this document has been printed on the basis of publicly available information, internal data and other reliable
sources believed to be true, but we do not represent that it is accurate or complete and it should not be relied on as such, as this
document is for general guidance only. Angel Broking Limited or any of its affiliates/ group companies shall not be in any way
responsible for any loss or damage that may arise to any person from any inadvertent error in the information contained in this report.
Angel Broking Limited has not independently verified all the information contained within this document. Accordingly, we cannot testify,
nor make any representation or warranty, express or implied, to the accuracy, contents or data contained within this document. While
Angel Broking Limited endeavors to update on a reasonable basis the information discussed in this material, there may be regulatory,
compliance, or other reasons that prevent us from doing so.
This document is being supplied to you solely for your information, and its contents, information or data may not be reproduced,
redistributed or passed on, directly or indirectly.
Neither Angel Broking Limited, nor its directors, employees or affiliates shall be liable for any loss or damage that may arise from or in
connection with the use of this information.
Disclosure of Interest Statement
Top Picks
1. Financial interest of research analyst or Angel or his Associate or his relative
No
2. Ownership of 1% or more of the stock by research analyst or Angel or associates or
relatives
No
3. Served as an officer, director or employee of the company covered under Research
No
4. Broking relationship with company covered under Research
No
Ratings (Based on Expected Returns: Buy (> 15%) Accumulate (5% to 15%) Neutral (-5 to 5%)
Over 12 months investment period) Reduce (-5% to -15%) Sell (< -15%)
Hold (Fresh purchase not recommended)